· Richard Webber · Articles · 10 min read
Standing for election
Variations in participation rates between minority ethnic groups .
Perhaps the ultimate test of the inclusiveness of a society is the extent to which its elected representatives are representative of its adult population. In this section we look at the representativeness of the Westminster parliament and of the candidates who stand for election at a local level.
Improving the representativeness of their MPs has been an objective of the mainstream political parties across many elections. Inclusivity has been seen both as a means of widening the talent pool and of making it easier for underrepresented groups to identify with figures they may see representing them in the media. Labour has sought to become more inclusive through the selective use of all female shortlists. All parties have undertaken a deliberate search for candidates from minority groups, especially those with a Black African, Muslim or South Asian background.
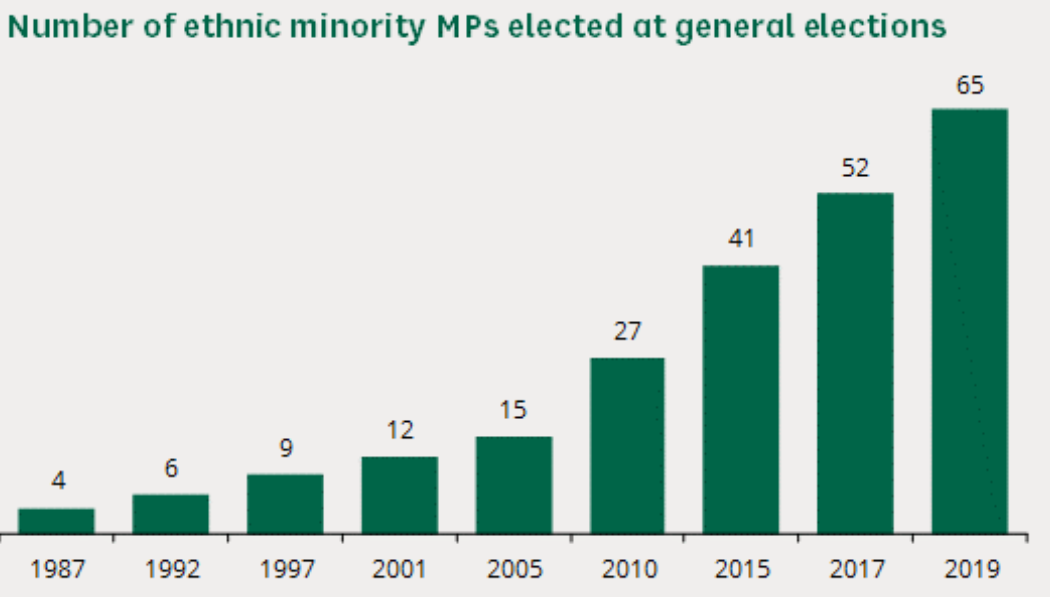
Despite occasional setbacks the number of women MPs and MPs from minority ethnic groups has grown consistently since the election of the Blair government in 1997.
If minorities are underrepresented in Westminster, who is it who is over-presented? Table xx which is taken from the parliament elected in 2005 shows the number of MPs according the origins of their name. This is compared with the number of MPs that the country would need to have elected for the parliament to exactly mirror the electorate.
The 2005 election returned 8 people of Asian or Muslim backgrounds, just one fifth of the number needed to be representative. Overall 33 more MPs from this group need to be elected to achieve parity with the country as a whole. An additional four MPs are needed from the Black African community.
The less obvious finding is the profile of the groups which are over-represented at Westminster, the Irish Catholic community, which has 50% more MPs than is justified by its size, and the Scots. The surplus of these two groups account for more than the entire deficit among non-British or European members.
| Origin of name | Actual MPs | If based on share of adult population | Surplus (+) or Deficit (-) | Index of Representation |
|---|---|---|---|---|
| Anglo Saxon | 421 | 406 | 18 | 104 |
| Scottish | 84 | 64 | 20 | 132 |
| Welsh | 40 | 40 | 0 | 99 |
| Northern Irish | 3 | 3 | 0 | 91 |
| Irish | 63 | 41 | 22 | 154 |
| European | 17 | 41 | -24 | 41 |
| Jewish | 5 | 1 | 4 | 430 |
| Black African | 2 | 6 | -4 | 34 |
| Asian and Muslim | 8 | 41 | -33 | 19 |
| All names | 643 | 643 | 0 | 100 |
What is the reason for the apparent surplus in the number of MPs with Scottish names? Is it that the Labour landslide of 1997 brought with it an influx of Labour supporting Scots? Table xx shows to the contrary. Proportionately the Conservative Party has a higher proportion of MPs from Scottish backgrounds than Labour. This is despite the Conservatives winning only one constituency in Scotland in 2005.
At the same time as the Scottish electorate fell out of sympathy with the Conservative Party, politicians with Scottish backgrounds were achieving success in being selected and being returned in England’s Conservative heartlands.
The surplus of Westminster MPs with names from Republican Irish backgrounds in part reflects the stronger links between this community and the Labour Party. Thus whilst MPs with Scottish backgrounds were equally divided between the two main parties, and with MPs with English backgrounds supporting Labour by a margin of 3 : 2, Labour MPs with Republican Irish backgrounds outnumbered the Conservatives by a margin of 5 :1, even greater than the margin among Welsh named MPs, 3 : 1.
Given the size of the southern Irish community, it is surprising how little focus the mainstream parties and the media have given to appealing to this vote which is as large as the Asian and Muslim communities combined.
| Origin of name | Conservative | Labour | Liberal Democrat | Scottish Nationalist | |
|---|---|---|---|---|---|
| Anglo Saxon | 135 | 229 | 46 | 0 | 410 |
| Scottish | 30 | 33 | 9 | 6 | 78 |
| Welsh | 8 | 23 | 5 | 0 | 36 |
| Northern Irish | 2 | 1 | 0 | 0 | 3 |
| Irish | 9 | 46 | 1 | 0 | 56 |
| Jewish | 3 | 2 | 5 |
Today, when so many of its members have achieved social and economic success, it is easy to overlook the fact that Britain’s Republican Irish community is the largest to have suffered systematic and widespread discrimination. But the legacy of this discrimination is still evident in the composition of the Westminster parliament.
One might suppose that this is a declining legacy, the effect of an ageing and declining cohort. In the election of 1945, which result in party representation very similar to that in 2005, there were only 14 MPs with Irish family names, a quarter of the number sixty years later. All 14 sat on the Labour benches. Though the Irish vote may have been as solidly Labour as the Black, Muslim and Asian vote today, it took many more elections for the Irish to achieve fair representation as candidates and eventually as MPs. Indeed it was not until Callaghan succeeded Wilson in 1976 that Britain had its first Prime Minister with an Irish family name and of Irish descent.
What about the Jews? The 1945 election returned ten MPs with Jewish names, all representing Labour or the Communist Party, a huge over-representation given the size of the Jewish community in Britain. 60 years later not only had this number had declined to five but the majority no longer sat on the Labour benches. This five were by no means the only MPs from Jewish backgrounds. This minority is still hugely over-represented but no longer partisan in the way its forebears were.
What relevance do these two trajectories have for the representation of Britain’s Black and Asian communities? Like the Irish, will the South Asian communities move from a condition of under-representation at Westminster to the over-representation? Like the Scots will the allegiance of their political class split from that of the sentiment of the community from which they originate? Like the Jews will elapsed time dull the memory of discrimination and encourage the more socially and economically ambitious members of the community to provide greater support to the party of enterprise as against the party of solidarity?
The Election Centre at the University of Plymouth have been collecting and commenting on British election results since 1984. During that period they have registered the votes cast for xx,xxx candidates in local government elections. The family name of each of these candidates has been recorded. Personal names are known for some but not all the candidates.
Candidates who want to stand for election must include their name and address on their nomination papers. But they are not asked to self-identify the ethnic group that they feel they belong to. On the other hand it is likely that many electors will be able to make an inference as to what the candidates’ ethnic backgrounds are from their names. In this particular instance the group that a person appears to belong to may have a more significant effect on the voters that the community that person actually feels he or she is part of.
Are people with non British names less likely to stand in council elections than people with British names? If so which are the communities whose members are the most likely to stand for election? Which party are they most likely to stand for? And do they poll more or fewer votes than a person whose name appears to be English?
To answer some of these questions the University made available a list of candidates who had stood in a local council election since xxxx in order to establish differences between the various communities in terms of willingness to stand. The names of more candidates could easily have been used, right back to xxxx. However we realised that if we were going to compare the number of candidates from different backgrounds with the British population, such a comparison would not be valid if we used data from a period when there were many few members of minority groups than there are today.
Contrary to the evidence of involvement in the Highgate Society, giving donations to the National Theatre and supporting Amnesty International (topics covered in earlier sections of the book), non White groups were much more likely to come forward when offered the opportunity to stand for election to a local council.
The proportion of candidates who are not of white British origin is 9.5 %, not so low in relation to the proportion of the proportion of non British origin, 14%. As in the Westminster parliament there is a strong over-representation of candidates with Jewish names. Seven Jewish candidates stood for election to local government for every four that there would have been if members of the community were no more likely to seek election than the rest of the population. The over-representation of MPs with Irish names is not reflected at the local level.
People from Continental European backgrounds are only two thirds as likely to stand as they need to be in order to be representative. The more established a community’s political system the more likely its members are to stand for election in Britain. People of French, Dutch, German and Scandinavian origins are more interested in getting elected than members of Eastern European communities, Italians, Spaniards or Greek Cypriots. Russians, Poles and Albanians are among the least likely to stand, no doubt in part because their communities are less well established than West Indians, West Africans and South Asian.
Among the Black and Asian communities there are some quite different levels of interest in standing for election. Both Afro-Caribbean and with Muslims have no issue with standing for the council. They are at as likely to stand as the white British and more likely to stand than white Europeans. The Bangladeshi and Pakistani communities are particularly well represented on the ballot paper. Sikh are less active politically than South Asian Muslims but more active that people of Hindu origin who make up only fifty per cent of the candidates they should do, a similar level to the East Asians and a bit higher than the Black Africans. The least likely to stand are the Chinese and, within the Chinese population, the Mandarin speaking Chinese.
The impact of religion is illustrated by the fact that people with Muslim Indian names are twice as likely to stand for election as people with Hindu Indian names.
| Party for which standing | % of candidates from Africa, Middle East, Asia | Index of representation |
|---|---|---|
| Adults | 7.287 | 100 |
| Labour | 6.703 | 92 |
| Liberal Democrat | 5.160 | 71 |
| Conservative | 4.912 | 67 |
| All Candidates | 4.848 | 67 |
| Plaid Cymru | 3.628 | 50 |
| Green | 2.794 | 38 |
| Independent | 2.672 | 37 |
| UKIP | 1.116 | 15 |
| BNP | 0.181 | 2 |
The major parties have been much more effective than the minor ones in recruiting Black African, Muslim and Asian candidates, Labour especially. The Conservatives and Liberal Democrats have probably been more successful in recruiting candidates from non white minorities than they have voters.
Among the various white communities the Conservatives have had more success than Labour in recruiting candidates from various of the Catholic communities, Spaniards, Italians and Poles for example. Jews no longer stand disproportionately for Labour. The Nigerians form one of the largest blocs to stand primarily for Labour and other than the Turks, who more often than not stand as Conservatives, Muslims have formed a good source of candidates not just for Labour but also, as a result of their stand on Iraq, for the Liberal Democrats.
Their support for the Muslim community has made it difficult for the Liberal Democrats to recruit Indian Hindi or Sikh councillors. The Green Party has found it even more difficult.
The policies of the parties do influence who stands for them. To become representative of the voters the BNP needs to recruit 50 times more non-white candidates, UKIP seven times more. For people from Germany the Green party is the natural choice of party to stand for. For people with continental European names it is appropriate that they should stand disproportionately for the Liberal Democrats, the party which has been most supportive of membership of the European Union.